Humane Guide to Debugging Web Apps
Content and code examples of this guide are licenced with Creative Commons CC BY-SA 4.0 licence. The creation of this original work is supported by Spice Program.
Introduction
Debugging is one of those skills I wish students and junior developers were taught more from the beginning. It's a fundamental skill that is not dependent on a particular language or technology.
Debugging is a process of finding and fixing issues in your codebase. I have often seen developers trying to figure out the problems by looking at the code and reasoning with it, so in this guide I want to share an approach that helps you figure things out from outputs and state of your software.
This guide is aimed at both experienced developers as well as students and juniors. Everyone can benefit from better problem solving skills. It is a collection of individual techniques (both technical and non-technical) and tools that will be handy for frontend developers.
Table of Contents
Fundamentals of Debugging
Before we dive into tools and techniques to solve problems at the UI or code level, let's talk a bit about the fundamentals. These are things that are about the process and the mindset of debugging.
Breathe in, breathe out
Whenever you face an issue, whether it's during development or after a stressed call from your client, product owner or boss, the first and most imporant thing is to breathe in and breathe out.
Take a moment to avoid panicking out as that prevents us from approaching problems in a productive and pragmatic way.
Leave your assumptions at the door
The most effective way to approach debugging is to get rid of your existing knowledge and assumptions. If you ever find yourself thinking or saying "that part works" or "it does this" before you have actually tested it as part of your debugging process, you risk missing out solutions.
Software is complex and accepting that you might be wrong is not always easy. Becoming more pragmatic in your approach and treating debugging like a checklist can help you solve problems much faster.
Teaching students and junior developers has taught me that debugging is not a skill that's taught in many online courses or schools. Students get stuck trying to reason with their code as they lack the tools and skills to approach the problem from a more fundamental standing point.
Debugging is also a fundamental skill as the thinking process doesn't differ when you switch from frontend web development to backend or to embedded systems or machine learning. You just need to learn the appropriate tools to assist you in your thinking process.
From end result to codebase
There is a way to solve problems by reading code. In this guide, I won't teach you that. For very experienced senior developers, it can be effective but more often than not, I've seen it lead into people staring into the code until it starts staring them back.
Instead, I want to share a process, tools and techniques that allow you to figure things out from the end result inwards rather than the opposite way. Even though the technical examples in this guide are for certain languages, the same approaches apply to every code you write.
Minimal, Reproducible Example
Codebases of production software are usually quite big and complex which means that we might end up looking at one thing when another is the actual cause.
For this reason, reducing your problem to a minimal, reproducible example helps out when asking for help but can also surface the issue as you reduce the unnecessary complexity.
Stack Overflow has nice guidance for creating these to match their quality of questions. Even if you're not making a question, creating this kind of example helps you reason with your code.
- Minimal – Use as little code as possible that still produces the same problem
- Complete – Provide all parts someone else needs to reproduce your problem in the question itself
- Reproducible – Test the code you're about to provide to make sure it reproduces the problem
console.log and friends
The console object is a powerful toolset for
inspecting the state of your program. I won't go through every function
inside it but if you're interested in learning about more than what I walk
through here, check out
MDN web docs. To test out the examples below, you can copy-paste them into the console
of your browser's Developer Tools.
console.log
The first function is one that many Javascript developers are familiar with. It prints the parameters into the console.
console.log('Hello world')Inspecting the state of a variable
The first use case here is inspecting the state of variables. It's one of
the common ways that cause your program to misbehave and instead of trying
to follow the logic and flow in your code, add a
console.log, navigate to the correct point in
your application in your browser and you should see the output printed into
the console.
const city = "Helsinki"
console.log(city)
If you have a lot of these console.log calls in
your code however, it becomes difficult to know what is what. Using
template literals
helps you add text along the variable.
const city = "Helsinki"
console.log(`City is: ${city}`)
To print out multiple variables, you could use template literals as before:
const city = "Helsinki"
const country = "Finland"
const countryCode = "FI"
console.log(`City: ${city}, country: ${country}, countryCode: ${countryCode}`)
You can make that process easier for yourself by using object property value shorthand:
const city = "Helsinki"
const country = "Finland"
const countryCode = "FI"
console.log({city, country, countryCode})
Confirming execution reached certain point
An important aspect of debugging is putting your assumptions aside. Our
second use case of console.log is making sure
that the code did in fact reach a certain point in code.
Quite often I find myself writing a new function and wondering why it
doesn't work. I might spend a long time tweaking the function only to
realize, that function was never called. So I now try to always remember to
check that first by printing out some placeholder string like
"Reached function helloEarth()". It has saved me
so much time.
function helloEarth() {
  console.log('Reached function helloEarth()')
  doOtherStuff()
}

if(spaceTraveller) {
  helloMars()
} else {
  helloEarth()
}
Styling output with CSS
To stylize your output, you can use CSS in
console.log with
%c identifiers. Each %c starts a new block that
will be in effect until the next one or end of string and corresponds to
extra parameters to the function call.
const blue = "This is blue"
const boldRed = "and this is red and bold"
console.log(`%c${blue} %c${boldRed}`, 'color: blue', 'color: red; font-weight:900')
console.table
While console.log might be familiar to many
developers, there are other great functions in console object as well. First
one of them is console.table. You might be able
to guess what it does from its name. It's great for printing tabular data:
objects and arrays.
const matrix = [[100, 24, 71, 8], [7, 12, 24, 80]]
console.table(matrix)
const languages = [{
name: 'Javascript',
website: "https://developer.mozilla.org/en-US/docs/Web/JavaScript"},
{
name: 'Python',
website: 'https://www.python.org/'
},
{
name: 'Ruby',
website: 'https://www.ruby-lang.org/en/'
}]
console.table(languages)It provides you a nice table with resizable columns and as a table, it lines up similar data from different items for easier inspection.
console.trace
Next function from console object is
console.trace which allows us to inspect where
in the stack of the program we are right now. It's mostly useful for bigger
programs so this small example might not show its full potential. But
whenever you need to know how you ended up to a given point in code, it's a
great tool.
function level1() {
  level2()
}

function level2() {
  level3()
}

function level3() {
  level4()
}

function level4() {
  console.trace()
}

level1()
console.count
An age old saying in the computer science industry says
"There are 2 hard problems in computer science: cache invalidation,
naming things, and off-by-1 errors."
. If you want to make sure how many times something is ran in your
Javascript code (for example, an iteration of a loop, a function or a
if/else branch), you could debug it by creating a temporary variable,
incrementing it and printing out the result. Or you can use
console.count and get all that in one statement.
for(let i = 0; i < 10; i++) {
  console.count('Iteration of for loop')
}

function go(direction) {
 if(direction === 'UP') {
  console.count('Going up')
 } else {
  console.count('Going down')
 }
}

go('UP')
go('DOWN')
go('UP')
console.group
Last one of console functions that I'll showcase is
console.group(). It provides a way to group
console statements into different groups with headings and visual
separation.
function catchEmAll(pokemon) {
  console.group('At function body')
  console.log(`Gotta catch 'em all`)
  console.group('Inside loop')
  pokemon.forEach(mon => {
    console.log(`I choose you, ${mon} ${mon} ${mon}!`)
  })
  console.groupEnd()
  console.log(`Function catchEmAll has finished`)
  console.groupEnd()
}

catchEmAll(['Bulbasaur', 'Squirtle', 'Charmander'])
catchEmAll(['Articuno', 'Zapdos', 'Moltres'])
debugger
A single keyword in Javascript can do a lot to make your life easier as a
developer. debugger is a keyword that halts the
execution of your application and you can interact with variables and
continue the execution one step at the time.
In Google Chrome and Firefox, it only stops if you have your Dev Tools open, otherwise it will continue the program as if debugger wasn't called.
Debugger can be used for explorative debugging: you gain access to the
environment with current variables and their values. It's especially useful
when
console.log isn't
enough.
Steps
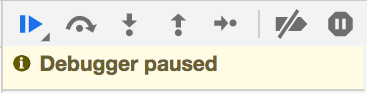
First thing debugger allows you to do is move forward in your code one line at the time. In Chrome's Sources tab and Firefox's Debugger tab, you can find different kinds of arrow buttons:
In Google Chrome:
In Firefox:
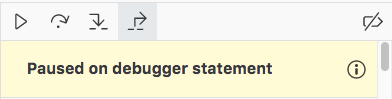
First icon that looks like a play button, will continue program's execution until the next debugger breakpoint.
Second button (arched arrow over a dot) jumps over the next line (and executes it). If that line has a function call, function gets called normally.
Third one (down arrow over dot or angled arrow into dotted line) steps inside a function.
Fouth one (up arrow over dot or angled arrow away from dotted line) steps out of current function.
Icon with a arrow sign with line crossing over allows you to turn debugger on/off.
Scope
This feature in Google Chrome can be found in Sources tab of Dev Tools. In Firefox it is in Debugger tab.
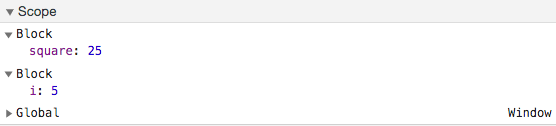
If debugger is active, you can find all the variables in the local scope from the Scope pane in Dev Tools. It's a handy way to see what variables exist and what their values are.
Let's try this out with a loop example:
for(let i = 0; i < 1000; i++) {
  const square = i * i
  debugger;
}
In Chrome's Scope pane, it looks like this:
Exploring variables in console
When debugger is active and you have Dev Tools open, opening the console allows you to run any Javascript commands. What makes it powerful with debugger is that you gain access to all the variables and functions in the current scope.
The following code has a small bug.
function calculateAverage(numbers) {
  const sum = numbers.reduce((acc, cur) => acc += cur, 1)
  const n = numbers.length
  return sum / n
}

// Should return 2, returns 2.3333333...
calculateAverage([1,2,3])
This example code might be something that we can figure out by just looking at the code. But with more complex calculations or data manipulations, it might not be so easy.
Now if we add a debugger statement before the return and re-run it, we can
open the console tab and print out numbers,
sum and n to see
what's happening there.
function calculateAverage(numbers) {
  const sum = numbers.reduce((acc, cur) => acc += cur, 1)
  const n = numbers.length
  debugger;
  return sum / n
}

// Should return 2, returns 2.3333333...
calculateAverage([1,2,3])
Now we find out that the sum of 1, 2 and 3 is calculated as 7 instead of 6 and we can fix the bug by changing reducer's starting value from 1 to 0.
Set breakpoints in Dev Tools
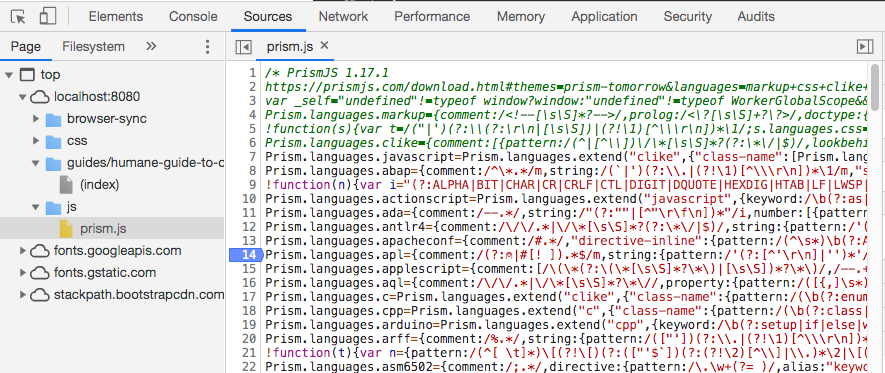
In addition to debugger statement, you can add breakpoints also directly from the browser's Dev Tools. This allows you to stop the execution of the program without changing the source code when you're debugging in your browser.
First one is a normal breakpoint that acts just like the debugger above. In Sources (Chrome) or Debugger (Firefox) tab, you can open a Javascript file from the sources pane and click on any line number to set up a breakpoint. Clicking it again deletes that breakpoint.
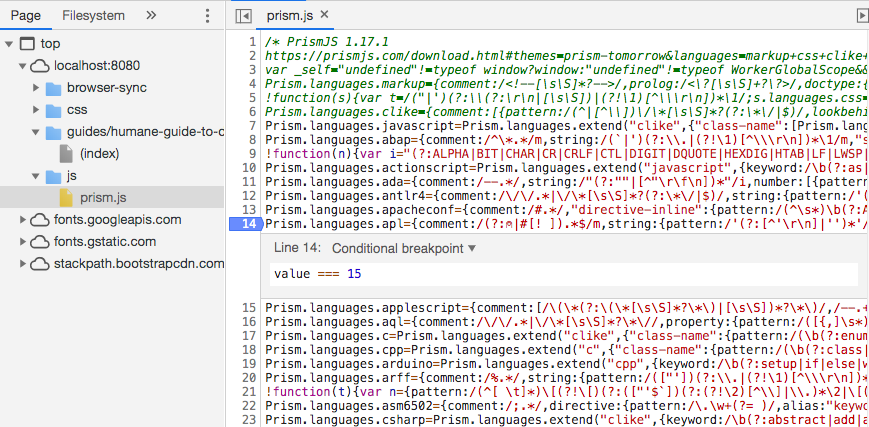
Extra feature is to add a conditional breakpoint that gets triggered if a Javascript statement provided returns a truthy value. This can be done by right clicking on the line number and selecting Add conditional breakpoint.
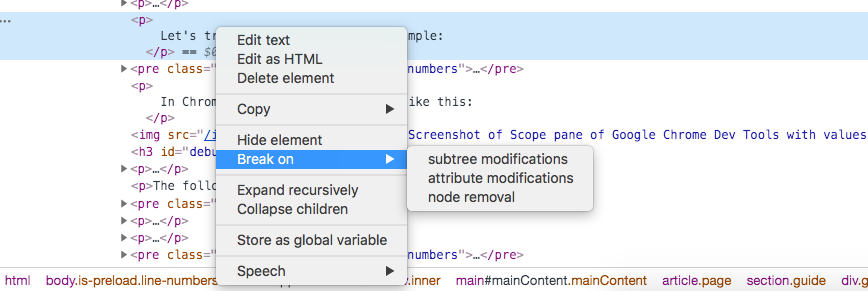
Additionally, in Google Chrome you can add breakpoints on DOM elements in the Elements tab. You can choose to break on subtree modifications, attribute modification or node removal. This can be useful for example when debugging a feature that adds or removes classes from a DOM element.
Debugging HTTP calls
In 2020, much of web development is built around calling APIs and displaying data. This is especially true for single page applications (SPA) that might not have any content on the site during the initial server request but all data gets fetched from APIs via HTTP calls.
That is another point in our process where we might assume one thing, debug our frontend code and get frustrated because our assumptions don't end up matching the reality. So let's learn a couple of ways how to debug these calls.
Network tab
Both Chrome and Firefox provide a nice interface via their Network tab. Every request gets logged here with basic information immediately available: status code, endpoint or filename, response size and so on.
To have an example that we can look at, let's do a call to PokemonTCG.io API.
fetch('https://api.pokemontcg.io/v1/cards')After running this line, there should be a new entry in the Network tab. By clicking this individual request, we gain even more information.

Headers tab gives us information about the request: which URL did we make the request to and using which method, what was the status code, which headers are involved.
Preview tab gives us a console-like output of the data we can dig into. I use this one most to make sure in which format the data is received and if the data looks correct. In my personal experiences, quite often bugs in the frontend have been related to something in the backend being wrong (during development) or me misintepreting what format the data is coming from the API.
Response tab provides us with the raw response data. In our case, it's a JSON string. In case of HTML documents, you get the HTML source.
REST clients
Debugging calls when figuring out an issue in the front end is often efficient in the network tab. But when debugging the API itself, REST client applications are a wonderful tool.
There are many different options for these. I won't do a in-depth tutorial on any particular one as they all look a bit different and provide bit different functionality. So instead, I'll showcase a couple of them that you can download and test for yourself.
All of these provide tools to do requests, define query parameters and headers, and save requests for future use.
Some clients
Debugging CSS
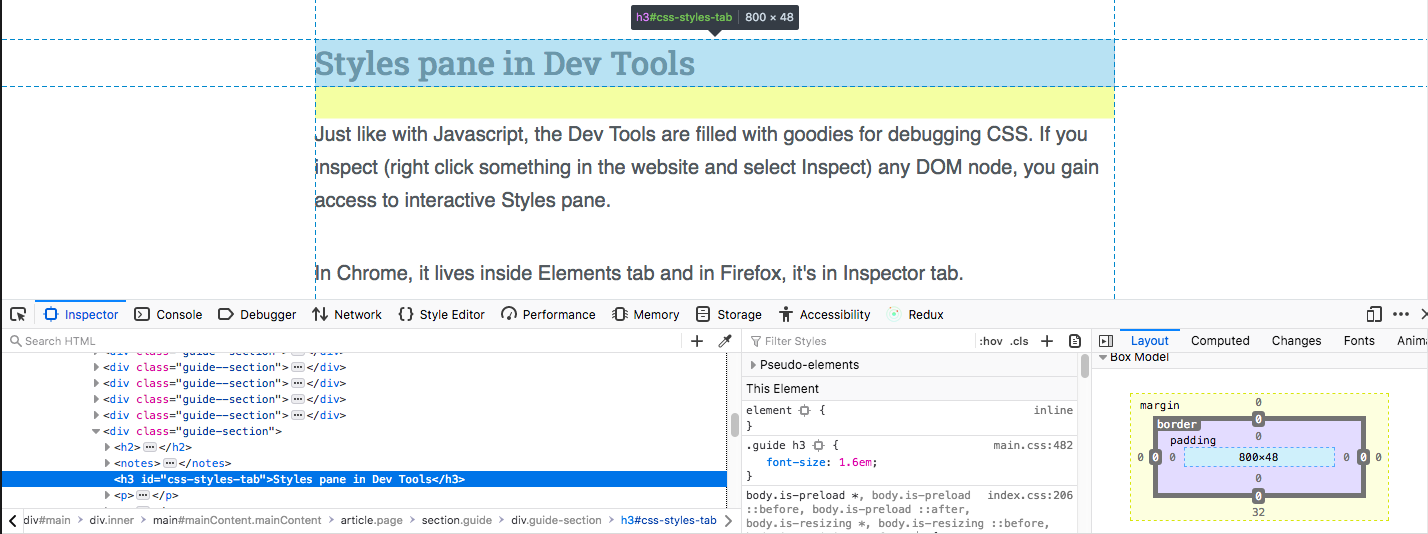
Styles pane in Dev Tools
Just like with Javascript, the Dev Tools are filled with goodies for debugging CSS. If you inspect (right click something in the website and select Inspect) any DOM node, you gain access to interactive Styles pane.
In Chrome, it lives inside Elements tab and in Firefox, it's in Inspector tab.
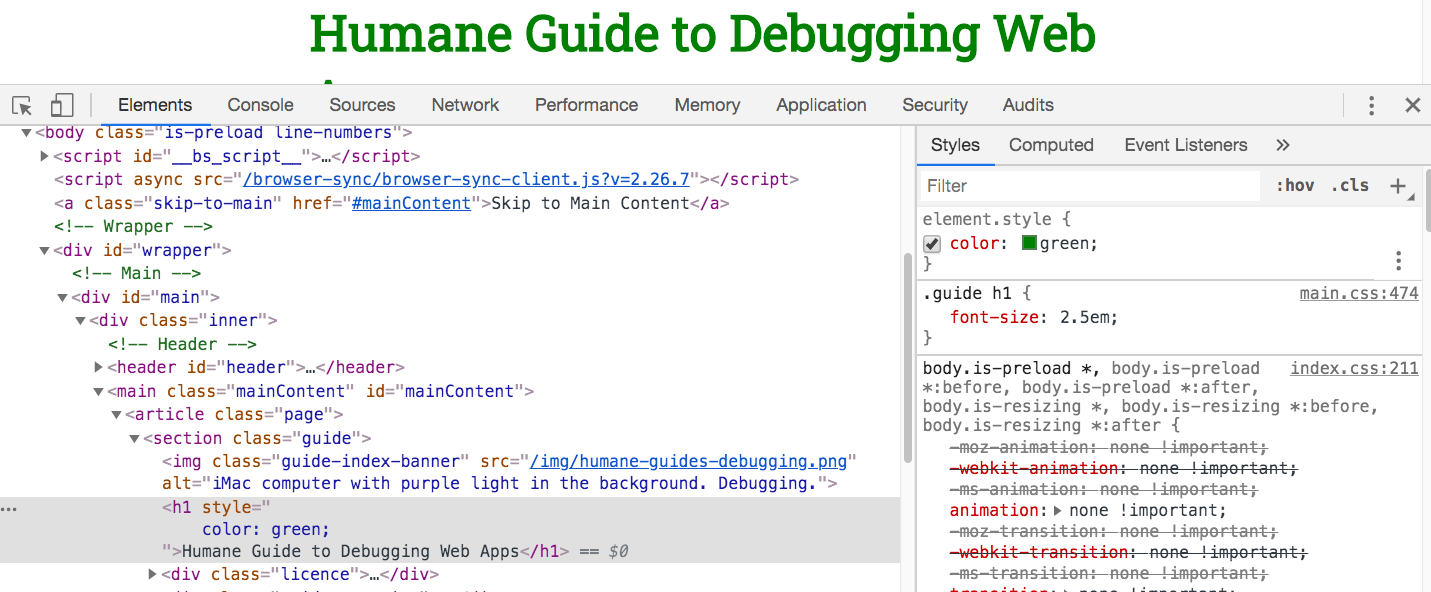
In this example above, you can see in the right couple of things:
- element.style is a selector that applies to only the element you have selected. You can add CSS properties and values, change them and with arrow up/down and shift/alt modifier keys, you can increase and decrease numeric values.
- .guide h1 and others like it are selectors that currently have active CSS properties that affect the current DOM.
-
Attributes with line over themare inactive styles that have been defined somewhere (inline, style tags, stylesheets). Clicking a checkbox besides any property disables them. - Colors have a colored square besides them. Clicking that opens a color picker that allows you to experiment with colors.
Styles pane allows you not only to see what the current values are, it also gives you the ability to test and experiment without having to change code and reload the page over and over again. I often work in this pane to find the good CSS values and then copy-paste them to my CSS files.
Couple of other nice features in the pane are pseudo-elements. Clicking :hov allows you to force element into a different state like focus or hover.
Box model
Box model pane lives in different places in different browsers. In Chrome, you can find it from Elements->Computed and in Firefox, it's in Inspector->Layout.
In Box model pane, you can see the size of the element and the individual values for padding, border and margin. By highlighting a HTML node, you can also see those same values visually inside the page itself.
CSS Grid in Firefox
Firefox has the best grid debugging tools out of all browsers. Chrome does an overlay of grid when highlighting an element in Dev Tools but that's pretty much it.
With Firefox, you gain a bit more. Let's take a look at an example. (This example was generated using CSS Grid Generator.)
<div class="parent">
        <div class="div1">1/1</div>
        <div class="div2">4/2</div>
        <div class="div3">3/3</div>
        <div class="div4">4/4</div>
        <div class="div5">5/1</div>
        </div>
.parent {
display: grid;
grid-template-columns: repeat(5, 1fr);
grid-template-rows: repeat(5, 1fr);
grid-column-gap: 0px;
grid-row-gap: 0px;
text-align: center;
border: 1px solid black;
}
.div1 { grid-area: 1 / 1 / 5 / 2; }
.div2 { grid-area: 4 / 2 / 5 / 3; }
.div3 { grid-area: 3 / 3 / 4 / 4; }
.div4 { grid-area: 4 / 4 / 5 / 5; }
.div5 { grid-area: 1 / 5 / 5 / 6; }The above code rendered to the page looks like this:
If we then open this in Firefox Dev Tools and look at the Grid section, we can see the grid itself as well as other valuable information.

Debug selector
One nice trick I learned some time ago is a debugging selector. It's basically an universal selector that selects all elements on page and applies a certain style to them. I have applied it to the Hello World example below but if you want, you can create that styling to entire page using the Styles pane.
* { outline: solid 1px red; }Hello world
- Example 1
- Example 2
- Example 3
Specificity calculator
The way browsers decide which styles to apply in case of conflicting ones is based on CSS specificity. There are some great tools to learn more about it but this web app Specificity Calculator gives you nice interactive tooling. If you happen to be a Star Wars fan, you might enjoy Stuff & Nonsense's CSS Specificity Wars.
Non-technical approaches
As I mentioned in the beginning of this guide, debugging is more than just tools. It's a mindset and process that helps find and fix problems. As such, not all problems are best solved by looking at a screen. Sometimes non-technical solutions are just the right thing and can save you from many headaches.
Different people have different approaches to this so this list is by no means exhaustive. Here are some that I use regularly and that have been very helpful for me.
Brain Dump
First step on the way is brain dump. I recommend doing this before all of the other approaches. The idea here is that what makes problem solving difficult is that we know (or actually assume) too much and that clouds our thinking.
Brain dump is a process of listing what's in your mind to give some space for new thoughts. (I'm not a psychologist nor neuroscientist. This might not be accurate.) Take a piece of paper and a pen (or digital equivalents) and walk through following steps.
Step 1: What's the problem?
First step is to formulate the problem. Sometimes we get stuck with
something because deep down, we don't really understand what the problem is.
Forcing yourself to put it into concrete words can help you improve your
understanding or it can reveal that you need to talk with someone who has
reported the issue to find out more.
Writing about your problem is like making a good bug report.
- What is the expected behaviour?
- What is not working?
- How to replicate the bug?
Step 2: What are your assumptions?
As discussed in Fundamentals section, we all
deal with assumptions constantly and they can make us not realize some even
otherwise obvious issues. One way these assumptions build up is when we
write code: we think about the way it's supposed to work so to figure out
what it really does, we need to get rid of those assumptions.
Some things to write down here:
- What do you think happens?
- What data do you have and what does it look like?
- What's the flow in the codebase, which functions are executed?
Step 3: What did you try?
List down steps that you have taken. Try to remember to only write down
things you have actually tried and verified. The assumptions here can cause
us to think "Of course that works, so I'll add it here" which can
cause us to skip some attempts to fix. Since many problems have a lot of
different things that can go wrong, listing the ones you have tried helps
you to avoid running in circles.
Walking & Sleeping
Before taking this approach, I highly recommend completing a brain dump.
As we approach the end of our list, we've had a lot of different tools at our disposal to find and fix issues. Sometimes, they are still there. That's when I recommend closing your computer and stepping away from it to do something else. Stop even thinking about the issue. Go for a walk, take a nap or a good night sleep, cook some food, clean your apartment or watch Netflix.
Giving your subconcious some time to process things is sometimes all you need. I have solved so many bugs by sleeping and when waking up, it's been obvious to me what to try, even though I spent hours not being able to figure it out while actively trying to solve the issue.
Rubber Duck
Finally, one of my all-time favorites: the ducks. You might have seen them in Internet pictures, your colleagues desk or heard about them in jokes. But they are so much more than a joke. Have you ever asked help from a colleague and after responding to their "Sure, what's up?", you realize you found the solution even before they reply. That's what rubber ducks are for.
Instead of bothering a colleague (which in general I do advice for: it's more often that developers don't ask for help when they should than the opposite. Especially if you're a junior developer, don't feel bad for asking help!), you can pick up your favorite duck (I have three!) and explain to that, what's going on. Go through the same steps as you do with brain dump but this time, explaining it to someone like they are your colleague. The social aspect sometimes surfaces different things than writing things down on a paper.
Here is my Sherlock Holmes Rubber Duck that has proven to be excellent at very difficult bugs.

Ask for help
While talking to a duck is an effective way to debug some things, bringing in another set of eyes and getting support from a colleague or a friend is good.
Another person doesn't know what you know so they can look at things from a fresh perspective. They also have different knowledge and experience than you do which helps in problem solving by expanding the knowledge base of the group solving the problem at hand.
As a junior developer, asking help can be scary. It can feel like exposing your weaknesses to more experienced people, including your bosses who can decide on whether you have your job or not. In a good work culture though, asking questions should be encouraged and I think junior developer's most important job is to ask questions, to gain understanding and to learn.