In a beautiful world, APIs would be open

I briefly talked about my dislike for walled gardens in my blog post In defence of Quote Toots and this past weekend has been a great reminder for myself why that is. Advertising as a main revenue model is one thing that causes a situation where it's more important that people see the information (and thus ads) in your website than for them to see the information.
I'm part of a few groups that are very passionate about hockey. This time of the year, that means we turn the knobs to the max as the NHL playoffs are on-going. For years, NHL has had a Bracket Challenge (and before that, I participated in fan-made bracket challenges for over 10 years) that we create our own league for, put in our bets and then see who reigns supreme at the end of the spring.
There are just a few tiny problems with that...
The Problem

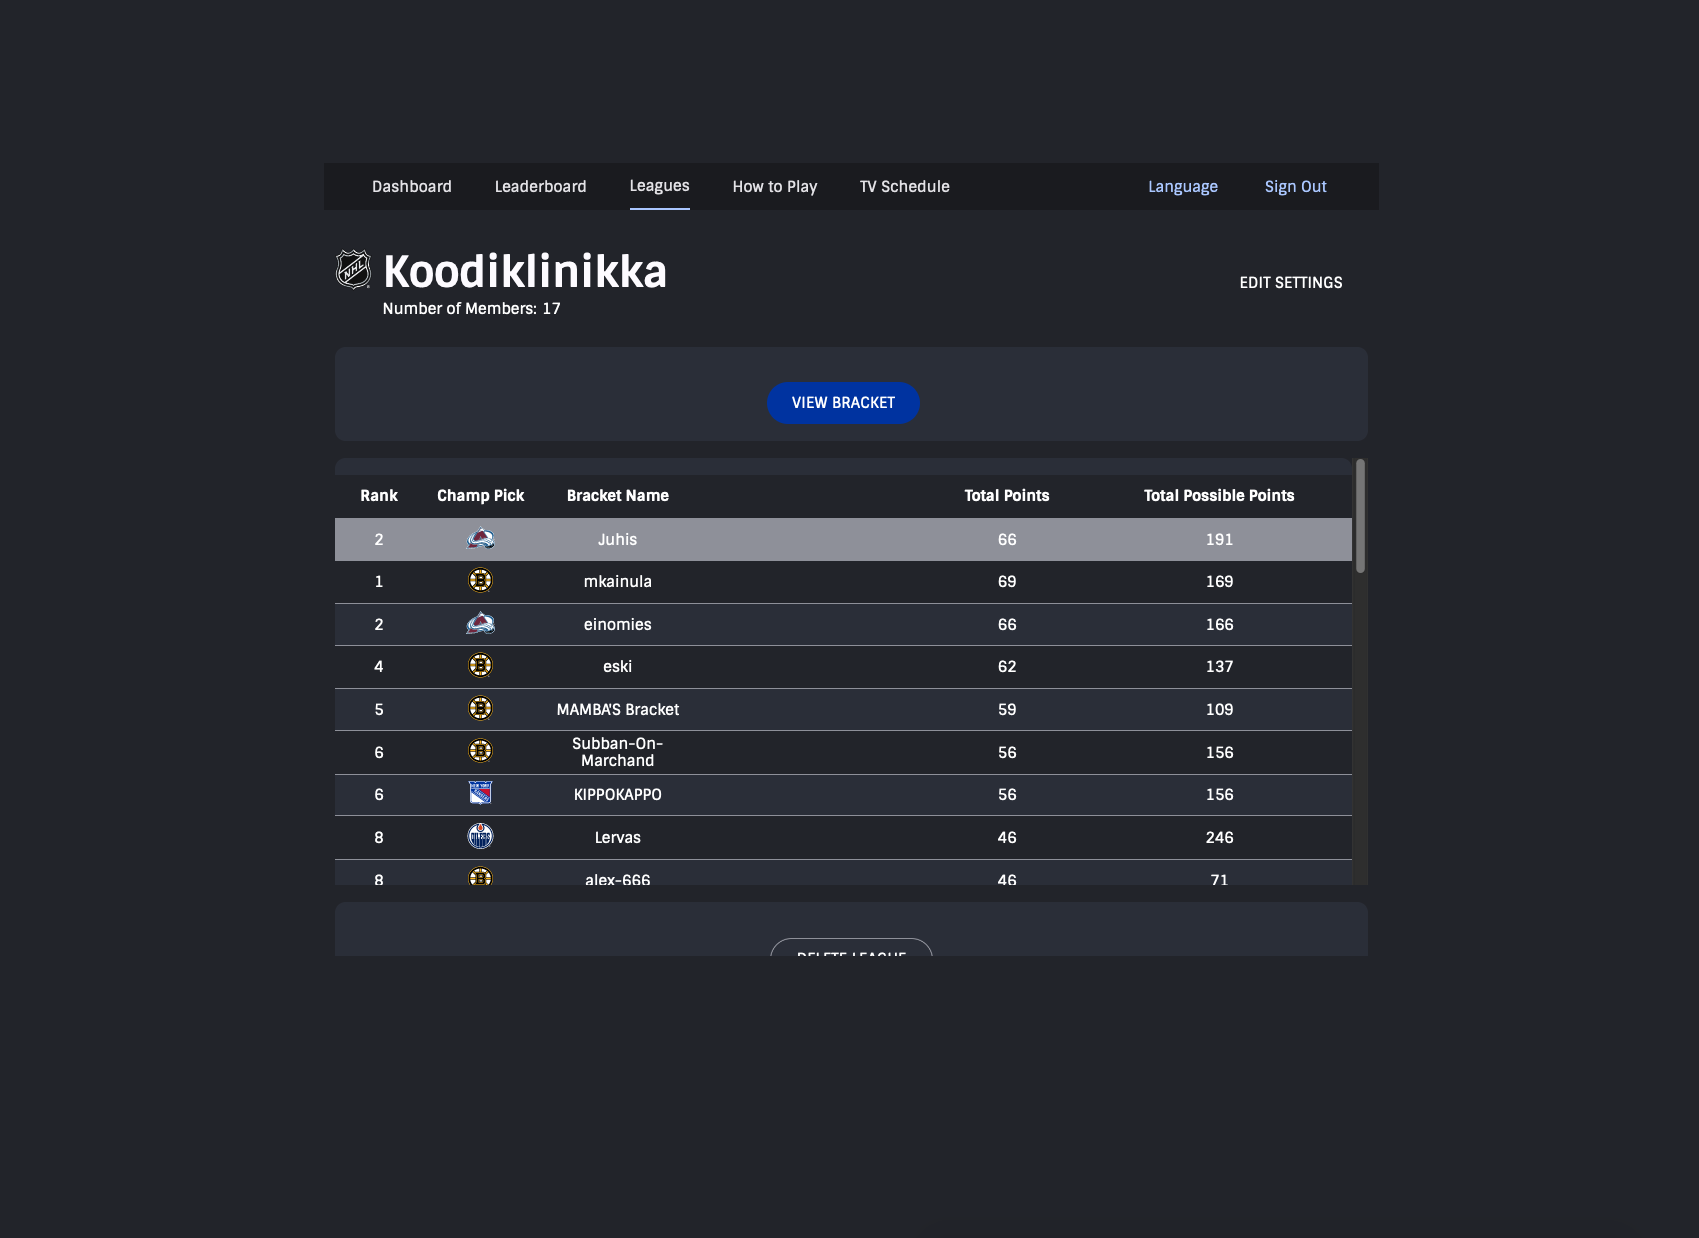
The main problem is that when you open the league view, you are greeted with this tiny box in the middle of the screen, not even showing all the players (we only have 16!) at once. Plus it shows me as the user always on top.
What I love to do every time a series ends is to post an update to our group Slack to bring a bit of story and hype to the series. It's really hard to get a good screenshot of that page.
Earlier years I was able to get around with custom CSS but this time it's lazy loading on scroll and once it loads, it appends, not replaces the data and a few other annoyances.
The Fix
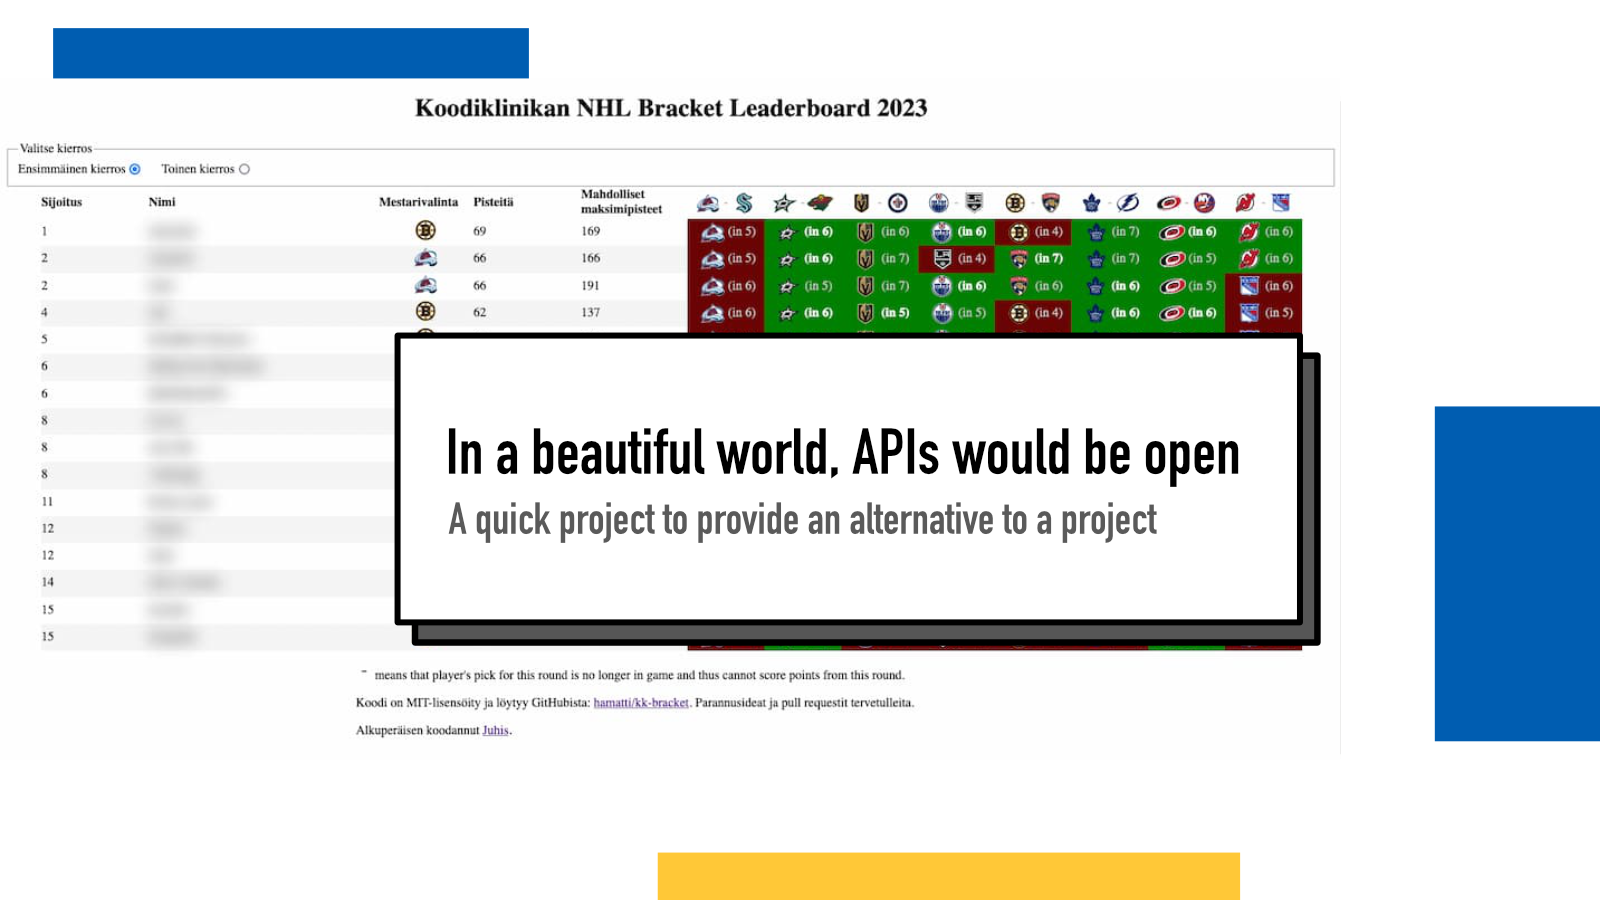
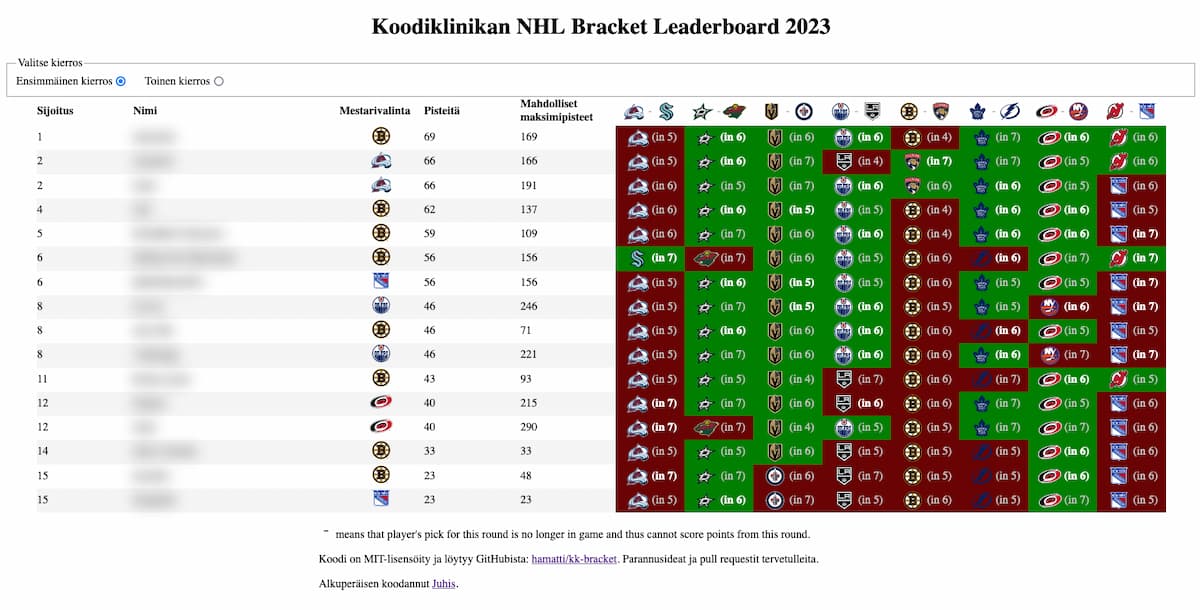
So last Friday after attempting to make the first update, I decided to build my own. Juho found that the APIs are open so I built a quick UI to display everyone's picks and points. This enabled me to share again with the group!

As days of the weekend went by, I added features, tweaked the functionalities and styling and had at least one other person pick up this code and use it for their own league!
It's not the most beautiful piece of art ever – I'm definitely not a designer – and it breaks horribly on mobile.
But it's one thing that open APIs would enable us to do: build alternatives, things that fit our needs and our desires instead of being blocked inside a walled garden.
I'm not sure if NHL planned for those APIs to be open so every morning I wake up to two worries: did my code break and did they close the APIs. So far, neither has happened.
As usual, I put the code out there in the open with a permissive MIT license into my GitHub. Maybe someone else picks it up and uses it to their own league. I already got a helpful contribution to make it usable on mobile.
Very likely this code won't work anymore next year but I'm hoping it survives until the end of these playoffs.
Imagine if it was all like this
I keep dreaming of the world where you'd have open APIs and open data and people could build their own imaginative projects on top. Different users have different needs and we could have a wide variety of tools, apps and UIs around the same data.
And you could then combine other sources of data too. Maybe we could spice up the bracket with highlight videos from Youtube or playoff stats from another API. Or showcase previous years' bracket scores. The sky is the limit.
But too often, the only thing that matters is getting people to your website so you can show ads and the actual content and data and competitions are just a lure to hook us into watching those ads.
And that makes me sad sometimes.
If something above resonated with you, let's start a discussion about it! Email me at juhamattisantala at gmail dot com and share your thoughts. This year, I want to have more deeper discussions with people from around the world and I'd love if you'd be part of that.
Comments
Loading comments...
Continue discussion in Mastodon »